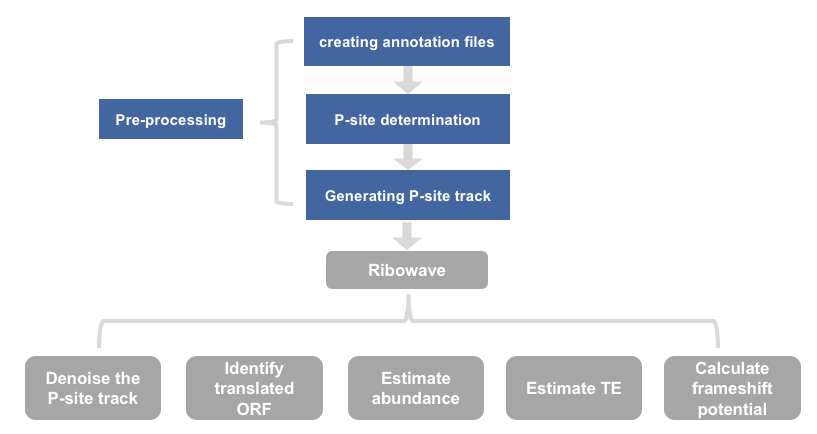
1) workflow
2) 背景介绍
(1) Ribo-seq原理
Ribo-seq是2009年Weissman课题组首次发表的研究细胞内蛋白翻译图谱的新型二代测序技术,用来描述全基因组水平蛋白质的翻译情况。主要是选择性捕捉80S核糖体及其结合的RNA片段而定位核糖体所位于的RNA的位置。
具体步骤为:
- 在细胞裂解物中富集多聚核糖体(polysome);
- 将多聚核糖体用核酸酶(RNA nuclease)消化成单核糖体(monosome)
- 选择性的收集和富集80S核糖体并经纯化得到80S核糖体所保护的RNA片段。
- 在此过程中,将80S核糖体保护的RNA片段进行下一步构建文库和测序(图1)。
- 最后,通过生物信息学的分析获得细胞当前状态下的翻译图谱 。
Ribo-seq数据测得的RNA片段长短与small RNA-seq相似,大约分布在25~35nt区间。由于Ribo-seq是特异性描述细胞的翻译组,因此其数据的测序片段大多比对到基因组的CDS区域(coding region)。此外,Ribo-seq还有一个明显区别于其他RNA-seq的特点,即Ribo-seq的序列在CDS区域往往呈现3-nt的周期性(图1)。这主要依赖于翻译过程中核糖体通常以3-nt的周期进行移动。
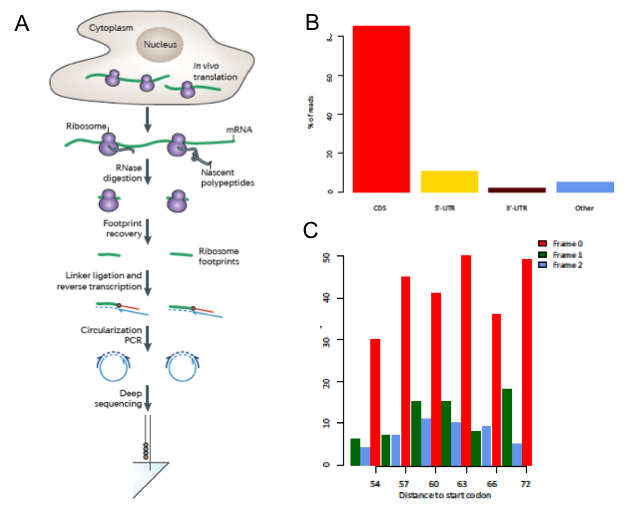
图1
(2) 环境准备
2.1
download scripts from https://github.com/lulab/Ribowave
2.2 Requirements
2.2.1 software:
R, bedtools v2.25.0
2.2.2 R packages:
reshape, ggplot2, rhdf5, methods, wmtsa, parallel
(3) Pre-processing
启动ribo-seq所用的docker(按照链接所示加载新的环境)
启动新的docker环境
docker load -i ~/Desktop/bioinfo_tsinghua_6.2_apa_6.3_ribo_6.4_structure.tar.gz
docker run —name=rnaregulation -dt -h bioinfo_docker —restart unless-stopped -v ~/Desktop/bioinfo_tsinghua_share:/home/test/share gangxu/bioinfo_tsinghua_6.2_apa_6.3_ribo_6.4_structure:latest
docker exec -it rnaregulation bash
进入工作目录
cd /home/test/rna_regulation
cd /home/test/rna_regulation/ribo-wave
3) running steps
(1) create annotation
# bedtools2没有添加到环境变量中,需要临时添加
export PATH=$PATH:test@bioinfo_docker:~/software/bedtools2/bin
# 运行annotation脚本(这一步时间会很久,生成文件已经提前跑好放在了annotation_fly目录下,可以跳过直接进行下一步)
script/create_annotation.sh \
-G annotation_fly/dmel-all-r6.18.gtf \
-f annotation_fly/dmel-all-chromosome-r6.18.fasta  \
-o annotation_fly  \
-s script
-
: the annotation gtf should contain start_codon and stop_codon information,eg: dmel-all-r6.18.gtf
-
: genome fasta ,eg: dmel-all-chromosome-r6.18.fasta
-
: the directory for all the annotation output
-
: the directory of all the scripts in the package
output files
annotation directory, including :
- start_codon.bed : the bed file annotating start codon
- final.ORFs : all identified ORFs, eg: FBtr0300105_0_31_546 where FBtr0300105 refers to the transcript, 0 refers to the reading frame relative to the start of transcript, 31 refers to the start site, 546 refers to the stop codon.
(2) P-site determination
核糖体上具有一系列与蛋白质合成有关的结合位点与催化位点,分别为A位点(aminoacyl-site,A-site),P位点(peptidyl-site,P-site)和E位点(exit-site,E- site)先后与tRNA发生结合。P位点是肽段翻译延长的主要场所,在该位点上tRNA将携带的氨基酸移交给旁边的肽段从而使得肽段序列发生延长。为了能够更加明显的观察到3-nt的周期性,在处理Ribo-seq数据时我们参考之前已发表的方法,对每一条Ribo-seq比对上的测序片段转换为其对应的P-site位点。
This step determines the P-site position for each Ribo-seq reads length by overlapping with the annotated start codons from previous step
# 运行P-site_determination.sh脚本
script/P-site_determination.sh \
-i GSE52799/SRR1039770.sort.bam \
-S annotation_fly/start_codon.bed \
-o GSE52799 \
-n SRR1039770 \
-s script;
-
: secondary alignment removed to ensure one genomic position per aligned read and sorted
- annotation :
: annotated start site start_codon.bed. It is generated in the create_annotation.sh step.
3. : the directory of the output result, eg: GSE52799
4. : the name of all the output file, default: test. eg: SRR1039770
5. : the directory of all the scripts in the package
**查看输出**
```
$ cd /home/test/rna_regulation/ribo-wave/GSE52799/P-site
$ ls
SRR1039770.psite1nt.txt SRR1039770.psite.pdf SRR1039770.psite.txt
#正常时输出这三个文件
$ cp *pdf /home/test/share/
# 拷贝pdf文件到容器与计算机互通的文件夹,可以用pdf阅读工具打开查看pdf
```
##### output files
P-site directory, including :
1. name.psite1nt.txt : the Ribo-seq reads length and its corresponding P-sites position(= offset + 1). It may look this this :
```
30 13
```
2. name.psite.pdf : the PDF displaying the histogram of aggregated reads
我们收集了所有已被注释的起始密码子并将 这些起始密码子和Ribo-seq 比对上的序列进行重合,分别计算Ribo-seq序列的5’端偏离起始密码子的第一个碱基A的距离(offset)。根据 Ribo-seq测序片段长度的不同,我们进一步将Ribo-seq片段分成多个组分。在每个长度对应的组分里,作出Ribo-seq片段5’端偏离起始密码子A的距离(offset)的直方图。
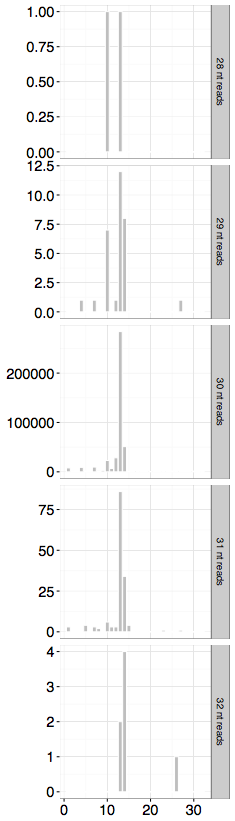
每一行代表不同长度的 Ribo-seq 测序片段的直方图。该数据中,30nt的reads数目最多,在30nt长度的Ribo-seq片段中,我们可以明显的看到在距离为13nt的位点含有一个峰值(peak)。鉴于大部分核糖体会在翻译起始位点停滞较多的时间,因此对于30nt长的Ribo-seq片段,其P-site位点的定义应该代表直方图中绝大多数的核糖体,因此我们将P-site位点应该定义为峰值最高的第13个碱基(13nt)的位置。
#### (3) Generating P-site track
基于Ribo-seq序列及其确定的P-site位点,将规律推广到所有Ribo-seq的片段中,直接根据Ribo-seq序列的长度推断其对应的P-site位点。根据这种方法,我们可以将每一条转录本上所有的Ribo-seq片段转化为对应的P-site位点的信号点并获得转录组水平的Ribo-seq信号轨迹(signal track)。由于是由P-site位点定义出的信号轨迹,通常也被叫做P-site信号轨迹(P-sites track)。转录本上每一个位点的信号丰度代表了有多少Ribo-seq片段对应的P-site位点落在该位置上。
This step creats the P-site track for transcripts of interests using determined P-sites position from previous step.
look at transcripts from chromosome X :
**查看输出**
```
script/create_track_Ribo.sh \
-i GSE52799/SRR1039770.sort.bam \
-G annotation_fly/X.exons.gtf \
-g annotation_fly/genome \
-P GSE52799/P-site/SRR1039770.psite1nt.txt \
-o GSE52799 \
-n SRR1039770 \
-s script
```
##### input files
1.
2. : a gtf file for only the exons from transcripts of interest, eg: X.exons.gtf
3. : the file including all the chromosomes and its genome size. Noted: genome can be obtained by using samtools faidx function with the input of fasta file. genome may look like this:
```
2L 23513712
2R 25286936
3L 28110227
3R 32079331
```
#### (4) P-site:
: the file listing the P-site position for each read length. This file can be found in the output of previous step, eg: name.psite1nt.txt
5. : the directory of the output result, eg: GSE52799
6. : the name of all the output file, default: test. eg: SRR1039770
7. : the directory of all the scripts in the package
**查看生成文件**
```#使用less命令查看psite文件
$ cd /home/test/rna_regulation/ribo-wave/GSE52799/bedgraph/SRR1039770
$ ls
final.psite
$ less final.psite
```
##### output files
1. bedgraph/name directory, including :
final.psite : P-site track at transcriptome wide. It may look like this :
```
FBtr0070533 0,0,0,0,0,0,0,0,0,0,0,0,6,2,0,0,0,0,0,0,0,0,0,0,0,0,0,0,0,0,3,1,0,0,0,0,1,0,2,1,0,0,0,0,0,0,4,8,0,0,3,0,5,12,0,0,0,0,0,0,0,0,0,0,0,0,0,0,0,0,0,0
FBtr0073886 0,0,0,0,0,0,0,0,0,0,0,0,0,0,0,0,0,0,0,0,0,0,0,0,0,0,0,0,0,0,0,0,0,0,0,0,0,0,0,0,0,0,0,0,0,0,0,0,0,0,0,0,0,0,0,0,0,0,0,0,0,0,0,0,0,0,2,0,25,0,0,0,0,0,0,0,0,0,0,0,0,0
FBtr0070604 0,0,0,0,0,0,0,0,0,0,0,0,59,6,0,1,0,0,2,6,1,0,1,0,0,0,0,0,0,0,0,0,0,0,0,0,0,0,0,0,0,0,0,0,0,0,0,0,0,0,0,0,0,0,0,0,0,0,0,0,0,0,0,0,0,0,0,0,0,0,0,0
FBtr0070603 0,0,0,0,0,0,0,0,0,0,0,0,75,2,7,10,7,2,0,0,0,0,0,0,0,0,0,0,0,0,0,0,0,0,0,0,0,0,0,0,0,0,0,0,0,0,0,0,1,1,0,0,0,0,3,3,1,0,0,0,0,0,0,0,0,0,0,0,0,0,0,0
```
#### (5) RiboWave
This step can achieve multiple functions :
1. denoising [denoise]
降噪:在降噪过程运用了小波变换来去除原始信号中非3-nt周期性的信号使得保留的信号均具有翻译的3-nt周期性,即PF P-site信号轨迹。
2. providing predicted p.value for each given ORF to identify its translation status [pvalue,-P]
鉴定ORF的翻译潜能:根据该转录本上经降噪后的P-sites是否富集在该ORF所在的阅读框内,判断ORF的翻译潜能。P<0.05即具有翻译活性。
3. providing reads density (P-site/PF P-site) for each given ORF [density,-D]
reads density = ORF上reads数/ORF长度,反映翻译水平的abundance。
4. providing translation efficiency (TE) estimation for each given ORF [TE,-T]
TE = 翻译水平的abundance/转录水平的abundance,反映翻译效率。
5. providing frameshift potential (CRF score) for each given ORF [CRF,-F]
鉴定潜在核糖体移码现象。
It might take hours to perform the analysis if the input is large. It is recommended to specify the number of CPU cores through the -p option.
Run Ribowave on example:
#### (6) Denoise the P-site track
```
# 在/home/test/rna_regulation/ribo-wave目录下
mkdir -p /home/test/rna_regulation/ribo-wave/GSE52799/Ribowave
script/Ribowave \
-a GSE52799/bedgraph/SRR1039770/final.psite \
-b annotation_fly/final.ORFs \
-o GSE52799/Ribowave \
-n SRR1039770 \
-s script \
-p 8
```
#### (7) Identifying translated ORF
```
mkdir -p /home/test/rna_regulation/ribo-wave/GSE52799/Ribowave
script/Ribowave \
-P \
-a GSE52799/bedgraph/SRR1039770/final.psite \
-b annotation_fly/final.ORFs \
-o GSE52799/Ribowave \
-n SRR1039770 \
-s script \
-p 8
```
#### (8) Estimating abundance
```
mkdir -p /home/test/rna_regulation/ribo-wave/GSE52799/Ribowave
script/Ribowave \
-D \
-a GSE52799/bedgraph/SRR1039770/final.psite \
-b annotation_fly/final.ORFs \
-o GSE52799/Ribowave \
-n SRR1039770 \
-s script \
-p 8
```
#### (9) Estimating TE
IMPORTANT : when estimating TE, user should input the sequenced depth of Ribo-seq and the FPKM value from paired RNA-seq
```
mkdir -p /home/test/rna_regulation/ribo-wave/GSE52799/Ribowave
script/Ribowave \
-T 9012445 GSE52799/mRNA/SRR1039761.RPKM \
-a GSE52799/bedgraph/SRR1039770/final.psite \
-b annotation_fly/final.ORFs \
-o GSE52799/Ribowave \
-n SRR1039770 \
-s scripts \
-p 8
```
#### (10) Calculating frameshift potential
on annotated ORFs
```
mkdir -p /home/test/rna_regulation/ribo-wave/GSE52799/Ribowave
awk -F '\t' '$3=="anno"' annotation_fly/final.ORFs > annotation_fly/aORF.ORFs;
script/Ribowave \
-F \
-a GSE52799/bedgraph/SRR1039770/final.psite \
-b annotation_fly/aORF.ORFs \
-o GSE52799/Ribowave \
-n SRR1039770 \
-s script \
-p 8
```
#### (11) Multiple functions
```
mkdir -p /home/test/rna_regulation/ribo-wave/GSE52799/Ribowave
script/Ribowave \
-PD \
-T 9012445 GSE52799/mRNA/SRR1039761.RPKM \
-a GSE52799/bedgraph/SRR1039770/final.psite \
-b annotation_fly/final.ORFs \
-o GSE52799/Ribowave \
-n SRR1039770 \
-s script \
-p 8
```
##### input files
1. bedgraph/name:
: output from the previous step, containing the P-site track of transcripts of interest, eg: final.psite
2. : ORFs of interest ,eg : final.ORFs. It is generated in the step of create_annotation.sh
3. : the sequenced depth of Ribo-seq to calculate FPKM , eg: 9012445
4. : FPKM table. It may look like this :
```
FBtr0100871 22262
FBtr0070604 18682
FBtr0100231 14746.5
FBtr0100874 14024.5
FBtr0100864 11475.6
```
##### output files
1. name.PF_psite : the denoised signal track(PF P-sites signal track) at transcriptome wide. It looks similar as the input final psite.
2. including chi-square P-value information. It may look like this :
```
column1-4: basic information about the ORF
column5: reads coverage within the ORF
column6: P-value predicted by RiboWave
column7: Values estimating the relative abundance of PF P-sites outside of the studied ORF
column8: Reads intensity at the current start codon
```
result directory, including :
3. name.95%.mx : RiboWave makes the prediction on the translation initiation sites and gives the final translated product output (p.value < 0.05) . It may look like this :
```
FBtr0070007_2_93_1028
FBtr0070008_1_128_943
FBtr0070025_2_135_1094
```
4. name.density : reads density ( PF P-site ) of given ORFs. It may look like this :
```
column1-4: basic information about the ORF
column5: number of PF P-sites in transcript
column6: number of PF P-sites in given ORF
column7: density of PF P-sites in given ORF
```
5. name.TE : TE of given ORFs. It may look like this :
```
column1: transcript
column2: ORF
column3: TE
```
6. name.CRF.final : ORFs that might experience reading frame translocation. It may look like this :
```
column1: ORF
column2: start of frameshift
column3: stop of frameshift
column4: PF P-sites' reading frames after the change point ,eg: 2_2,0_1 where 2_2 refers to continuous two PF P-sites of frame 2 followed by continuous one PF P-sites of frame 0.
column5: Relative position of PF P-sites after the shift ,eg : 1413,1440;1789 where 1413,1440 corresponds to the exact position of 2_2 within the transcript. Discontinuity in the reading frame is separated by ;
column6: CRF score describing the potential of frameshift
```
### 4) 数据库推荐
http://lulab.life.tsinghua.edu.cn/postar/